I think it’s common for a lot of developers in the PHP community to debug using var_dump or dd. I do this as well, it’s so ingrained in my workflow, nothing wrong with it really, but it’s fun how we choose to ignore actual debugging tools.
Back when I was working with Objective-C and C# I used the debugger exclusively, don’t really know why xDebug never stuck in my workflow for PHP.
One reason is that Sublime Text has poor support for it. But the other day I needed to debug something that dd just wasn’t the right tool for.
Homestead and xDebug
Homestead (the default vagrant box for larval projects) supports xDebug out of the box.
And the settings are located in /etc/php5/fpm/conf.d/20-xdebug.ini, which should look like this:
   zend_extension=xdebug.so
   xdebug.remote_enable = 1
   xdebug.remote_connect_back = 1
   xdebug.remote_port = 9000
   xdebug.max_nesting_level = 250
xDebug in Sublime Text
You need to install the xDebug Client for Sublime Text.
Next open your PHP project and go to the “Project” menu. Click “Save Project As…” and save it in the root of your project. You will need to edit it for xDebug to work from a vagrant box.
{
    "folders":
    [
        {
            "follow_symlinks": true,
            "path": "."
        }
    ],
    "settings": {
        "xdebug": {
             "url": "http://homestead.app/",
             "path_mapping": {
                "/home/vagrant/homestead" : "/path/to/your/project/"
             }
        }
    }
}
You should now be able to use xDebug from Sublime Text.
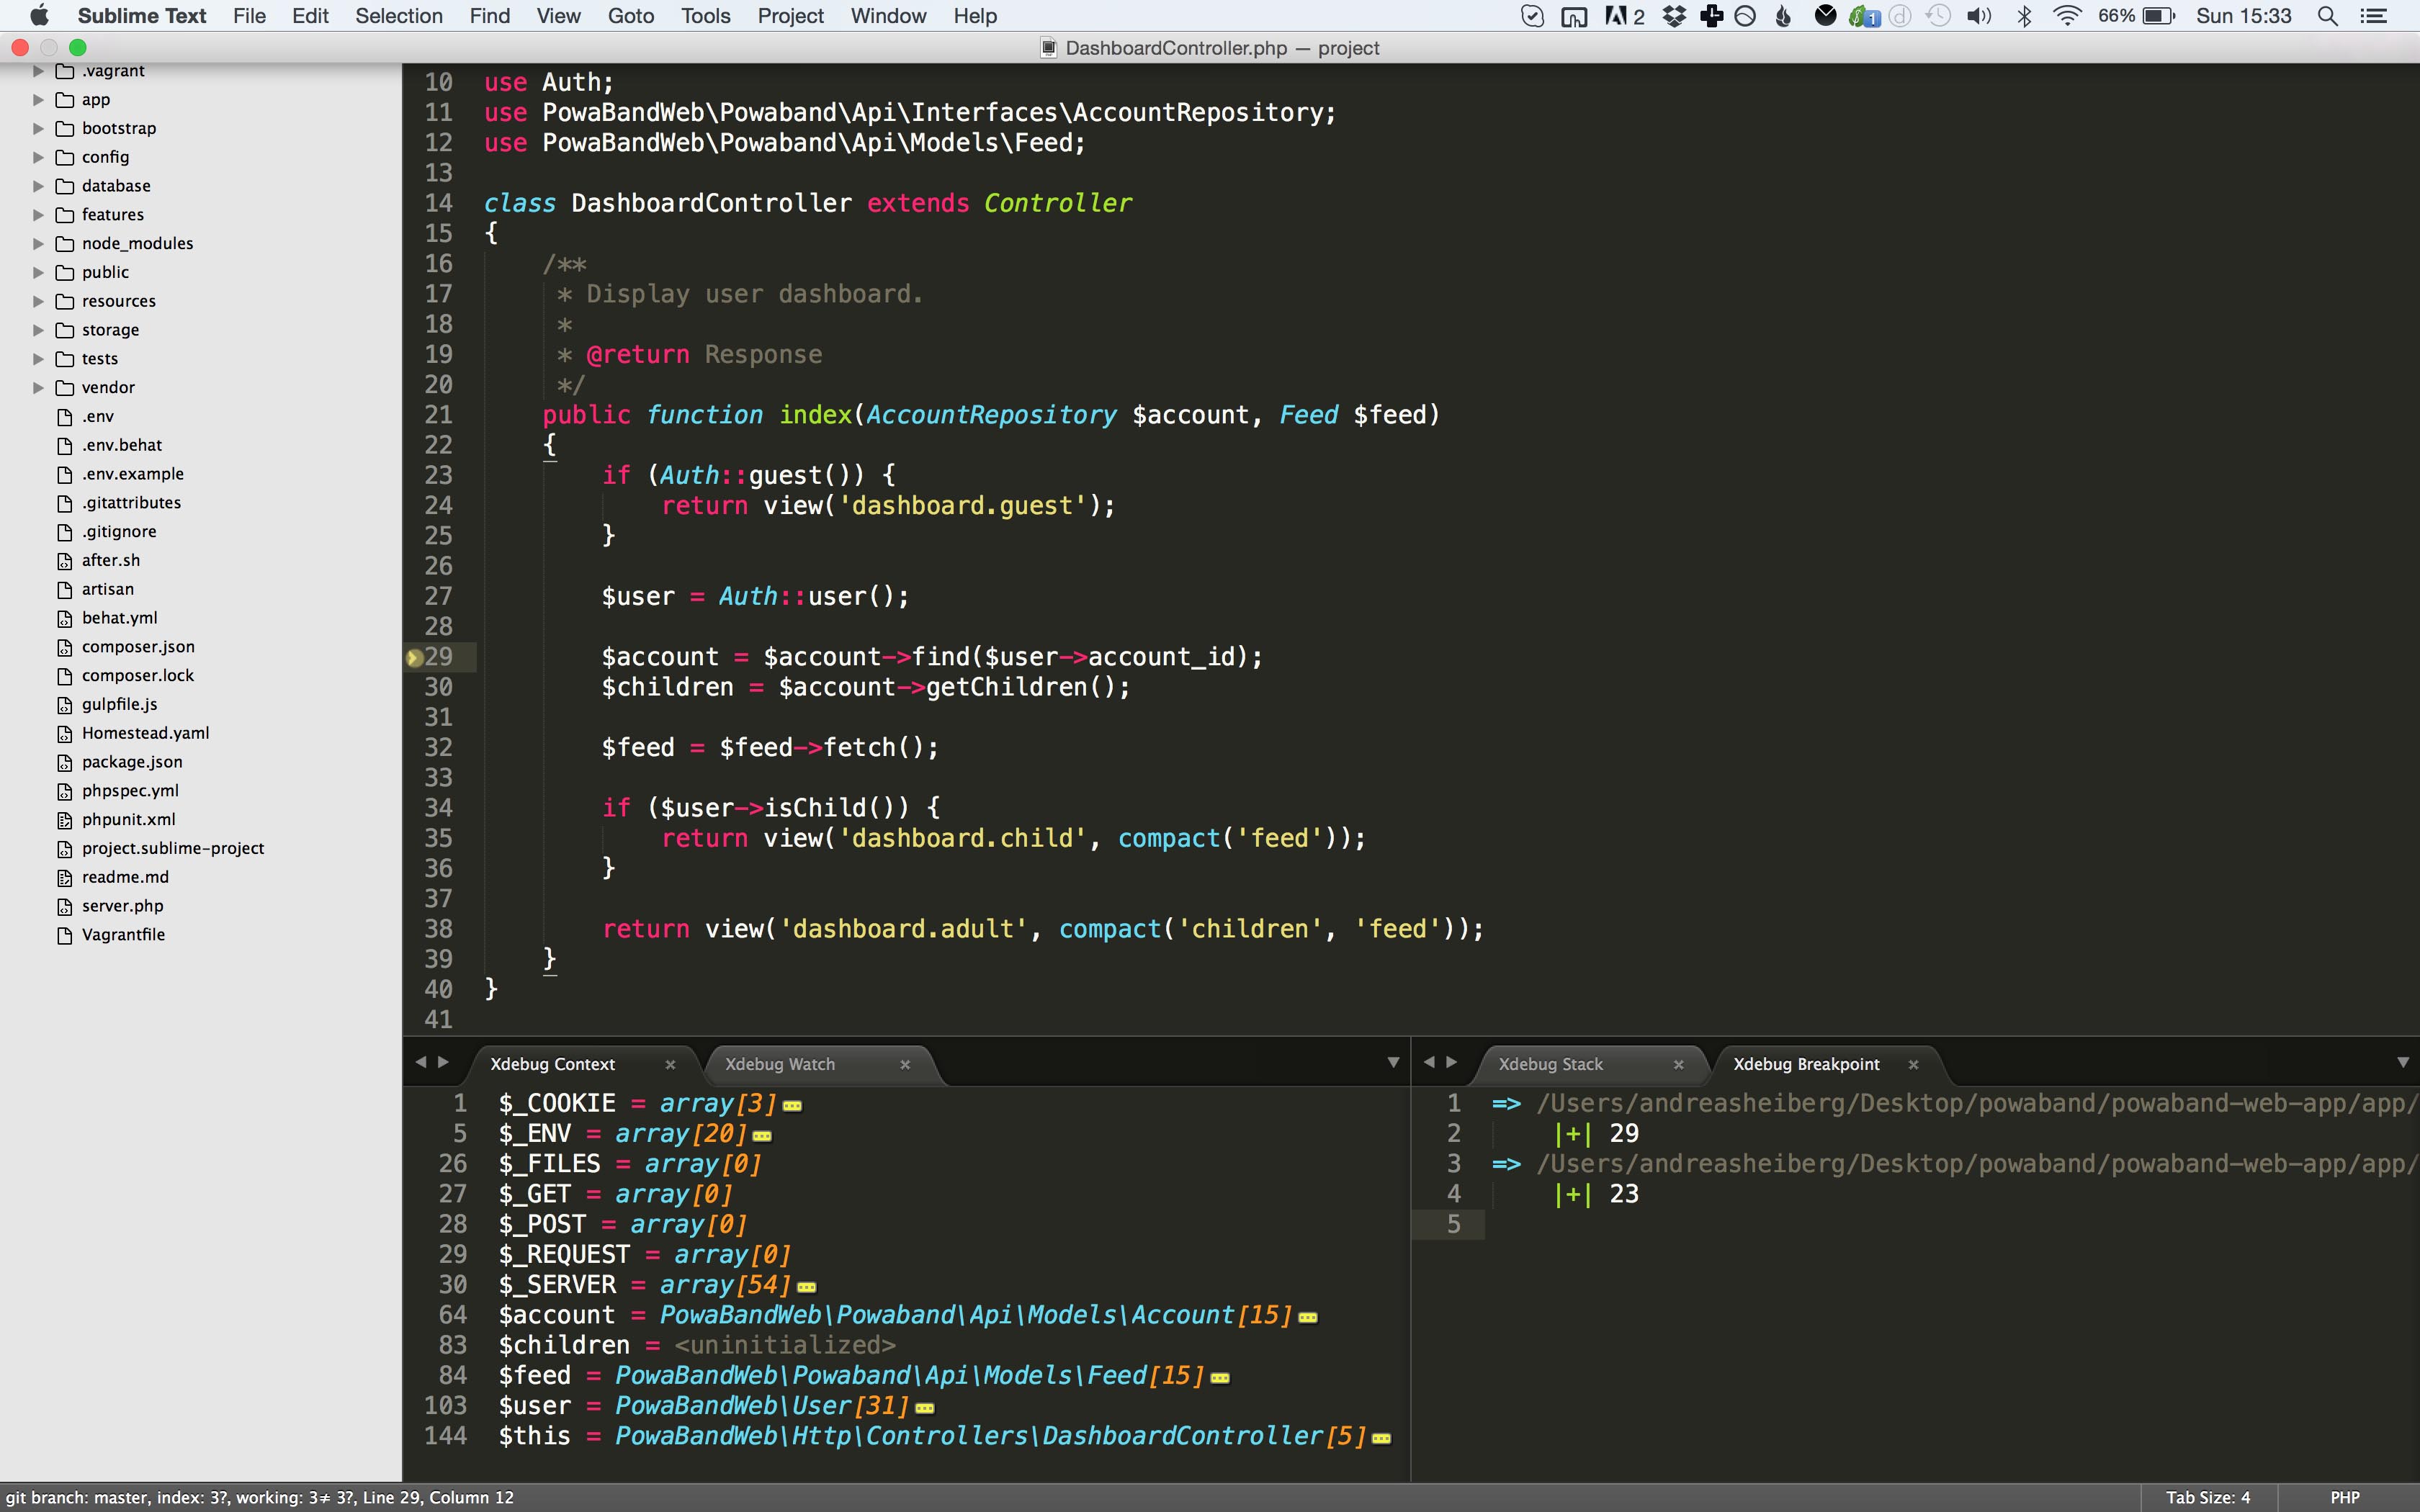
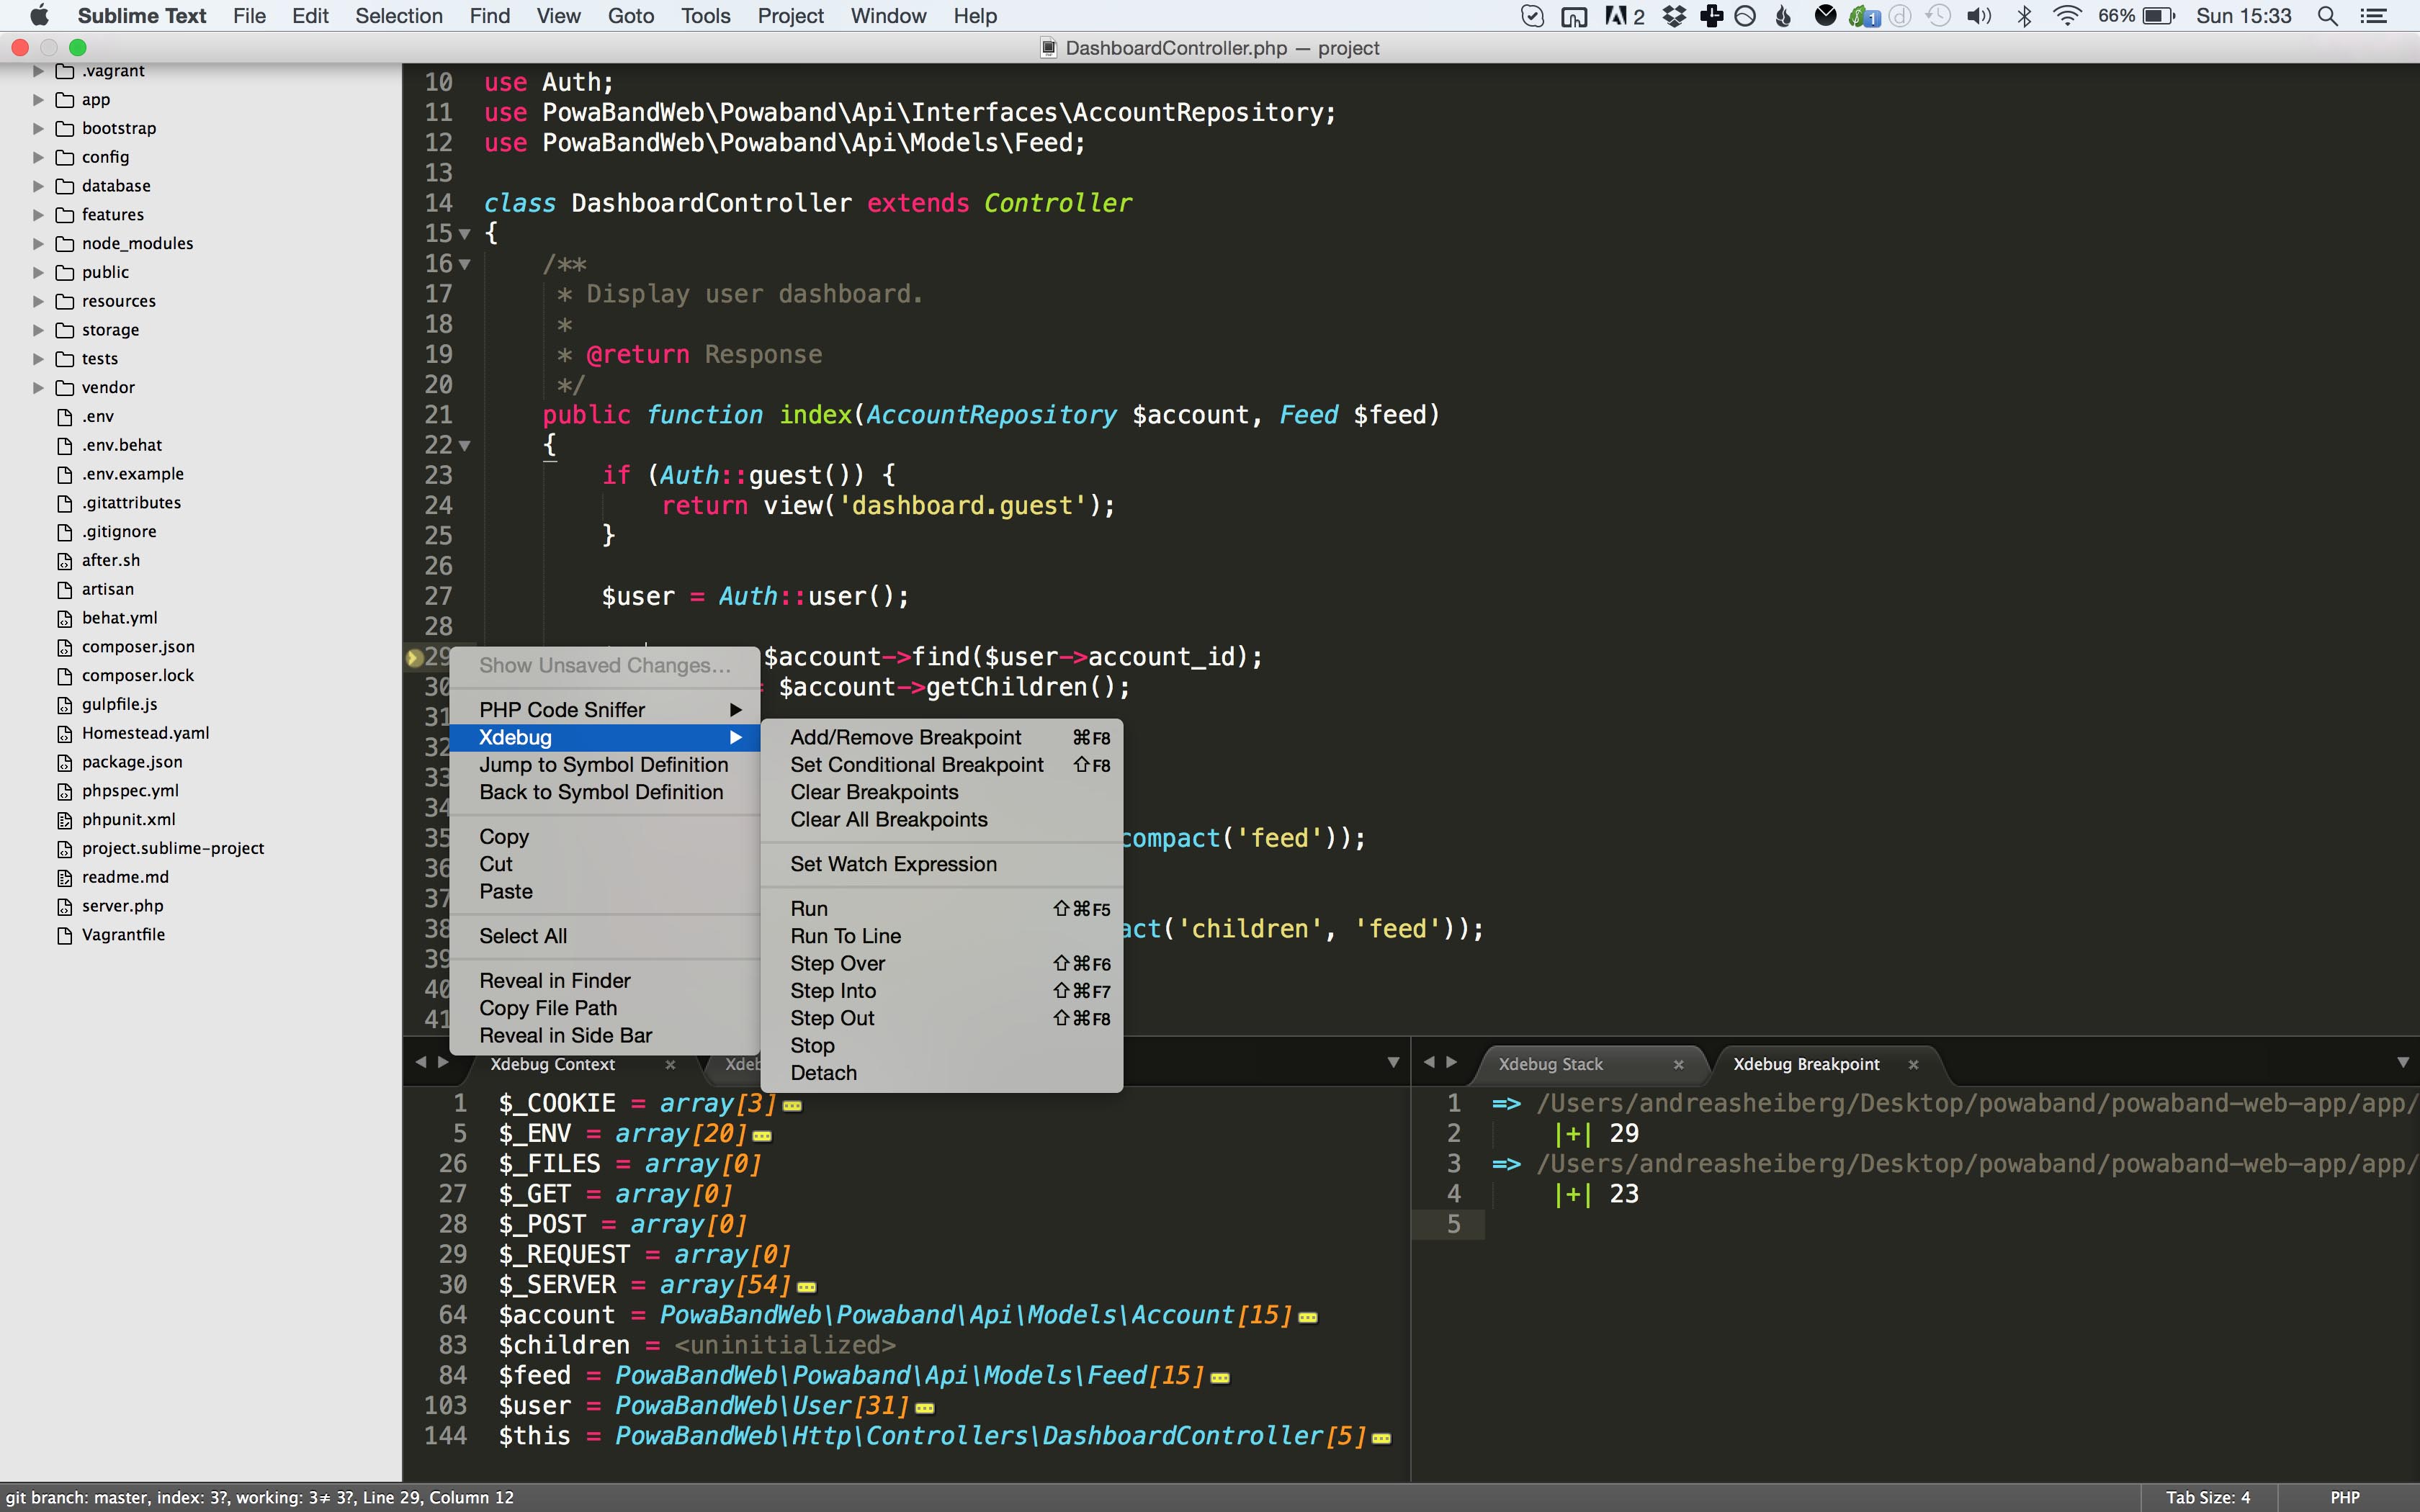
Screenshot and keyboard shortcuts
Google Chrome Plugin
Normally when using xDebug you need to append a query param to every url, like so “http://homestead.dev/?XDEBUG_SESSION_START=sublime.xdebug". This is a cumbersome and b it creates problems when you want to debug POST requests.
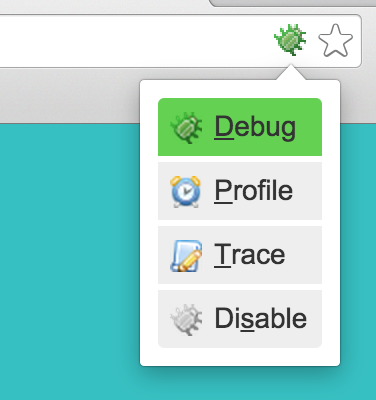
To fix this you can install this excellent chrome plugin
Now if you want to start a debug session you can just click the icon in your menu bar.